Adding an ExeWatch SDK to a Delphi application takes a few lines, and the Quickstart below is already everything you need. But as soon as the integration is up and the dashboard comes alive, the harder question arrives, the one the reference manual does not answer: what is actually worth keeping an eye on?
This guide answers that. It sits one level above the technical reference (the Docs page in the console, at https://exewatch.com/ui/docs). The reference tells you how to install, initialize, and call the SDK. This one tells you what is worth calling it for, and why, and when. It is built around situations you already recognize: the support call about a crash nobody can reproduce, the feature you are not sure anyone uses, the release that "feels slower" but nobody can prove it.
Quickstart
One uses clause and one initialization line. Everything else in this guide refines those two
things.
1. Add the SDK to your uses clause. In a VCL app, which is the vast majority of Delphi apps, that is two units. The second one is what captures GUI exceptions.
uses
  ExeWatchSDKv1, ExeWatchSDKv1.VCL;   // FireMonkey app: ExeWatchSDKv1.FMX instead of .VCL
You add only one of the two hook units, the one for the framework you are using. If the app has no
GUI, a Windows service or a command line utility for example, add neither .VCL nor .FMX. There
is no message loop to hook and ExeWatchSDKv1 on its own is enough.
2. Initialize once, early (in the .dpr before Application.Run, or in the OnCreate event of
the main form):
InitializeExeWatch('ew_win_xxxxxxxx', 'acme-corp');Two arguments: the API key you copy from the console, and the id of the customer this installation belongs to. Done, the app is monitored.
What those two lines bought you. From now on crashes are recorded with their stack trace without
you writing anything else, and the two units split the work. ExeWatchSDKv1 hooks
System.ExceptProc, where unhandled exceptions from ordinary code end up. ExeWatchSDKv1.VCL (or
.FMX) takes the ones that escape inside an event, an OnClick or an OnCreate: the framework
message loop intercepts them and hands them to Application.OnException, and that is where the trip
ends. They never reach System.ExceptProc. In a desktop app they are the most frequent category of
crash, and that is why the second unit matters.
An automatic Application started log goes out too, the confirmation that the integration is alive,
and the device information (operating system, machine, binary version) is sent and linked to the
customer. None of this travels on your application thread. Events go into a queue on disk and a
background thread ships them, so a slow network or an unreachable server never slows down or blocks
the app.
The hook unit does not take away the handler you had. If you already had your own
Application.OnException, the hook logs and then calls it; if you did not, it calls
Application.ShowException. The error window your user saw before still appears, unchanged. And if
one day you forget the unit in another project you are not left in the dark: the SDK notices it is
running in a GUI app with no hook installed and writes a Warning of its own, tagged exewatch,
which lands on your dashboard.
|
The stack trace always arrives, the line numbers do not: those need the To get them, once and for all: set Project Options, Building, Delphi Compiler, Linking, "Map file"
to Detailed (the other levels, Segments and Publics, do not contain line numbers; Publics
gives you method names but not lines). Then ship the You cannot ship it? That is a legitimate choice: the |
3. Log what interests you. From here on you log, count and time whenever you have something worth recording:
EW.Info('Monthly report generated', 'reporting');
EW.IncrementCounter('report.generated', 1, 'reporting');
Open the dashboard and the events are there. From here on the guide is about bringing to mind everything that deserves to end up in there, because the list is longer than the one you would come up with right now.
Then, one setting at a time
None of what follows is needed to get going. Add it when you actually need it, one line at a time.
Want to know which release an event came from? Pass a third argument.
InitializeExeWatch('ew_win_xxxxxxxx', 'acme-corp', '4.2.0');That is AppVersion, your release label ('4.2.0', '2026-Q1', 'v2-beta'). The binary version is a
separate field, which the SDK already reads from the executable on its own. This third argument is
for when your idea of a release does not match the number compiled into the .exe.
You do not know the customer at startup? Initialize anyway, with an empty id, and set it as soon as you find out. The how and the why are in the Initialization: beyond the one-liner section, a little further on.
Integrating each SDK
That Quickstart was Delphi, the flagship. The what and why in the rest of this guide are the same
for every SDK; only getting it in and initialized differs. Here is the setup for each. In all of them
the last argument is your release label (AppVersion), and the API key is platform-prefixed
(ew_win_, ew_lin_, ew_web_, and so on).
Delphi (native). As in the Quickstart: ExeWatchSDKv1 in the uses clause, plus
ExeWatchSDKv1.VCL (or .FMX) if the app has a GUI, then
InitializeExeWatch(ApiKey, CustomerId, '4.2.0'). The VCL/FMX unit captures unhandled GUI
exceptions for you.
.NET. Reference the ExeWatch package (add ExeWatch.WinForms for a WinForms app), then
initialize once at startup:
using ExeWatch;

EW.Initialize("ew_win_xxxxxxxx", "acme-corp", "4.2.0");
ExeWatchWinForms.Install();   // WinForms only, before Application.Run()

EW.Info("Application started", "startup");
A console or service app skips the Install line: the client hooks AppDomain.UnhandledException on
its own. WinForms needs the explicit Install before Application.Run.
Python. Install the SDK, initialize the singleton, and use the module-level ew afterwards:
from exewatch import initialize_exewatch, ew

initialize_exewatch("ew_win_xxxxxxxx", "acme-corp", app_version="4.2.0")

ew.info("Service started", "startup")
ew.increment_counter("job.run", 1, "jobs")
Python has no GUI to hook, so capture failures where you handle them with
ew.error_with_exception(exc, "tag"), or point sys.excepthook at it for a global net.
JavaScript (browser). You declare the configuration in window.ewConfig and then load the
script from exewatch.com. The key is a ew_web_ key, and the SDK captures window.onerror
automatically:
<!-- the configuration first... -->
<script>
  window.ewConfig = {
    apiKey: 'ew_web_xxxxxxxx',
    customerId: 'acme-corp',
    appVersion: '4.2.0'
  };
</script>

<!-- ...then the script, served from exewatch.com -->
<!-- Production (minified, 12 KB) -->
<script src="https://exewatch.com/static/js/exewatch.v1.min.js"></script>

<!-- Development (readable, 35 KB) -->
<script src="https://exewatch.com/static/js/exewatch.v1.js"></script>
The order matters: the SDK initializes itself on DOMContentLoaded by reading window.ewConfig, so
the configuration has to be on the page already when the script is loaded. Serve the script from
exewatch.com, not from a copy of your own, so fixes reach your users without you having to
redistribute anything.
This SDK is browser only, there is no Node build. Uncaught errors are collected for you, along with
fetch and XHR failures and console.error calls. On a page that loads third-party scripts,
ignoreUrls in the same ewConfig discards errors coming from domains you do not control,
advertising and analytics for instance. That is noise which tells you nothing about your
application.
DLL (C, C++, VB, legacy .NET, anything with a C ABI). Load ExeWatchSDKv1DLL.dll and call the
flat exports. Strings are wide (PWideChar), every function is stdcall, and results come back as
return codes:
ew_Initialize(L"ew_win_xxxxxxxx", L"acme-corp", L"4.2.0");
ew_IncrementCounter(L"report.generated", 1.0, L"reporting");
Because a flat C ABI cannot walk the host stack or run a callback, two jobs fall to the host: pass
a resolved stack string to ew_ErrorWithStackTrace, and drive periodic gauges from your own timer
(there is no periodic-gauge callback). A Delphi host that prefers the DLL over the native units can
use the import unit ExeWatchSDKv1Imports and call EWInitialize(…) instead of
InitializeExeWatch.
The same thing, in full, with MSVC. No import library and no Embarcadero runtime: define
EW_DYNAMIC_LOAD before the header and every ew_* becomes a function pointer, which
ExeWatchSDKv1.dynload.c resolves at runtime with LoadLibrary and GetProcAddress. This is a
complete program, not a fragment:
#define EW_DYNAMIC_LOAD
#include "ExeWatchSDKv1.h"
#include <cstdio>

int wmain()
{
    // looks for ExeWatchSDKv1DLL_x64.dll in the standard Windows search path
    if (ew_LoadSDK() != EW_OK)
    {
        fwprintf(stderr, L"ExeWatchSDKv1DLL_x64.dll not found\n");
        return 1;
    }

    if (ew_Initialize(L"ew_win_xxxxxxxx", L"acme-corp", L"4.2.0") != EW_OK)
    {
        wchar_t err[1024] = {};
        ew_GetLastError(err, 1024);
        fwprintf(stderr, L"Init failed: %ls\n", err);
        ew_UnloadSDK();
        return 1;
    }

    ew_Info(L"Sample application started", L"startup");
    ew_IncrementCounter(L"report.generated", 1.0, L"reporting");

    ew_WaitForSending(15);   // returns how many events are left queued: 0 = everything sent
    ew_Shutdown();
    ew_UnloadSDK();
    return 0;
}
It compiles in a single command, from an "x64 Native Tools Command Prompt for VS 2022", passing the folder that holds the header and the loader:
cl /EHsc /W4 /nologo /I<sdk-folder> main.cpp <sdk-folder>\ExeWatchSDKv1.dynload.cThe only line here that is not ceremony is ew_WaitForSending. A command line utility can exit
before the shipper thread has drained the queue, and that call writes the buffer to disk and waits
for the queue to empty, returning how many events are still pending. It is not a data-loss problem,
because the queue lives on disk and picks up again on the next run, but without the wait your events
show up on the dashboard one run late. The compilable sample with everything else, user identity,
global tags, breadcrumbs, nested timings and gauges, is in
ExeWatchSamples/MSVCWithDLLSDK.
The same DLL from a Delphi console app. A Delphi host can use the DLL instead of the native
units too, and in two cases that is the right choice: when you are on a Delphi older than XE8, which
is the floor for the native SDK, and when you have several applications to update by shipping a
single binary. The import unit ExeWatchSDKv1Imports goes back as far as Delphi 5. This one is a
whole program too:
program EWConsole;

{$APPTYPE CONSOLE}

uses
  ExeWatchSDKv1Imports;

var
  LRemaining: Integer;
begin
  if EWInitialize('ew_win_xxxxxxxx', 'acme-corp', '4.2.0') <> EW_OK then
  begin
    WriteLn('Init failed: ', EWGetLastErrorStr);
    Exit;
  end;

  EWInfo('Nightly batch started', 'batch');
  EWIncrementCounter('report.generated', 1.0, 'reporting');

  LRemaining := ew_WaitForSending(15);
  if LRemaining > 0 then
    WriteLn(LRemaining, ' events are still queued: they will go out on the next run.');

  ew_Shutdown;
end.
The wrappers with the EW prefix accept string and do the conversion to PWideChar themselves,
so no cast appears in your code. Since this is a console app, the same two lines as before apply:
ew_WaitForSending before exiting, and ew_Shutdown to close cleanly.
One thing to know before you ship. By default the unit links the DLL statically, so
ExeWatchSDKv1DLL_x64.dll has to sit next to the executable at startup. If it is missing the
process does not start at all: Windows stops it with a missing-DLL error before your first line of
code runs. If you would rather have the application start anyway and only give up telemetry, define
EW_DYNAMIC_LOAD in the project options. The unit switches to LoadLibrary, and you call
EWLoadDLL at startup and check its result, the way the MSVC example above does.
And with Free Pascal. There is nothing Delphi-specific about the DLL: it is a flat C ABI,
stdcall, wide strings. On Windows the same ExeWatchSDKv1Imports compiles under FPC, which the
unit detects and switches to {$MODE DELPHI} by itself. Where string is not Unicode the internal
alias becomes WideString and the EW* wrappers convert for you, so the code you write stays the
code in the example above.
Initialization: beyond the one-liner
The Quickstart’s single InitializeExeWatch call is all most apps ever need. That third argument is
AppVersion, your own release label ('4.2.0', '2026-Q1', 'v2-beta'); the binary version is a
separate, auto-detected field read from the executable, so you get both from the one line. Here is
what to reach for when that line is not enough.
|
You do not know the customer yet? Initialize anyway. In most real apps the SDK should be live from the first line, so a crash during startup is captured, but you only learn which customer this installation belongs to after you read a license file or the user signs in. Initialize with an empty customer id and set it once you know it. |
// in the .dpr, before Application.Run, so the SDK is live immediately
InitializeExeWatch('ew_win_xxxxxxxx', '', '4.2.0');

// ... later, once you know the customer (from a license file or after sign-in):
EW.SetCustomerId(Session.CustomerCode);
This is a deliberate, supported flow, not a workaround. While the customer id is empty the SDK holds
back the device-info record, because it needs the id to attach the device to the right customer, and
sends it the moment you call SetCustomerId. If the id later changes (a different customer on the same
machine) the SDK re-sends the device info under the new customer, so the device shows up correctly for
both. The rule is simple: initialize first, identify when you can.
Customer and user are two different identities, set with two different calls. SetCustomerId sets
the customer: the account or tenant this installation belongs to, which is what the dashboard groups
devices and alerts by. Who is actually using the app is a separate thing, the user, and you set that
with SetUser:
// after the person signs in:
EW.SetUser('u-8842', 'mario.rossi@acme.example', 'Mario Rossi');
// on sign-out:
EW.ClearUser;
The id, email, and name then ride along with every event as user_id, so a crash shows not just which
customer hit it but which person. Use SetCustomerId for the account and SetUser for the human;
they are independent, and you can set either, both, or neither.
|
|
When the three-argument call is not enough, build a TExeWatchConfig and pass that instead. Every
field has a sane default, so set only what you need:
var
  Config: TExeWatchConfig;
begin
  Config := TExeWatchConfig.Create('ew_win_xxxxxxxx', 'acme-corp');
  Config.AppVersion := '4.2.0';
  Config.SampleRate := 0.25;                // send 25% of routine events; Error/Fatal always sent
  Config.GaugeSamplingIntervalSec := 60;    // how often periodic gauges are read (default 30, min 10)
  Config.MaxPendingAgeDays := 3;            // purge unsent queued files older than this (default 7)
  Config.AnonymizeDeviceId := True;         // hash the username in the device id (GDPR / AD)
  Config.GlobalTags := [TPair<string, string>.Create('edition', 'pro')];
  InitializeExeWatch(Config);
end;
The settings worth knowing:
-
SampleRate (0 to 1): the fraction of routine events actually sent.
ErrorandFatalalways bypass sampling, so you can thin out info and debug volume on a large fleet without ever dropping a crash. -
GlobalTags and InitialCustomDeviceInfo: tags and device fields applied before the very first event, so even the automatic "Application started" log already carries your context.
-
GaugeSamplingIntervalSec: how often the sampler thread reads your periodic gauges (default 30s, floor 10s).
-
MaxPendingAgeDays: while the app is offline, events queue on disk; files older than this are purged, so a machine that was offline for weeks does not ship stale data on reconnect (default 7).
-
AnonymizeDeviceId: replaces the username part of the device id with a hash, for GDPR or Active Directory environments.
-
Endpoint: point the SDK at a self-hosted ExeWatch instead of the default cloud. On-premise only.
The other SDKs take the same concepts under closely matching field names; the reference has the exact signature for each.
Why this guide exists
A blank dashboard is intimidating, and the first question is always the same: where do I start? The short answer is that if something interests you, record it. Do you want to know whether that function fails? Log it. How many times it gets used? Count it. Whether it is slow, and by how much? Time it. The mistake that costs you is not having sent a few events too many. It is standing in front of a production problem and finding that the one piece of code involved has nothing to say.
That moment always comes, and it comes on a Tuesday afternoon with a customer on the phone. You have the stack trace of the crash but you do not know what the user was doing a moment earlier, because you never logged that step. You know the sync takes forever but not which phase eats the time, because you timed only the total. In those twenty minutes you never regret the lines you sent too many. You regret the three you did not write.
So start generous. If something can fail, if it can get slow, if you need to know how much it is used, if it explains why the app behaved the way it did, send it. Adding more is easy while you are writing the code. Adding it later, when the build in question is already installed at three hundred customers, means a release and weeks of waiting. And the noise, if there is ever too much of it, you can turn down whenever you like: the minimum level and the sampling rate of each application are changed from the console, without recompiling anything.
The only thing not worth sending is what says nothing even to you: a Debug('I am here'), an
Info('step 1'), a message with no context that makes sense only while you are typing it. The rest
of the guide is there to bring to mind what does deserve a place, and to pick the right tool for
each thing, since a crash, a usage count and a duration are recorded in three different ways.
The five questions
Before the recipes, the map. ExeWatch gives you five instrumentation tools, and each one exists to answer a different question. Almost every "what do I track here?" decision becomes obvious once you know which question you are asking.
| The question you have | The tool that answers it | What you point it at |
|---|---|---|
What happened? |
Logs (debug through fatal, with a tag and stack trace) |
discrete events a human would want to read: errors, state changes, "the user did X" |
How many, how often? |
Counters |
things you count and add up: feature uses, retries, exports, failures |
What is the value right now? |
Gauges |
a level that rises and falls: memory in MB, queue depth, open documents, cache size |
How long did it take? |
Timing (and nested traces) |
durations of operations, with traces to break a slow one into its phases |
Tell me when something is wrong |
Alerts |
a threshold on error or fatal log volume, or on operation duration, set in the console, not in code |
Two things are easy to miss, and both save you real work later.
Tags are the quiet sixth tool. Every log, counter, gauge, and timing call takes a tag, and
there is a process-wide SetTag for context that rides along with everything. Tags are how you
carve the dashboard into "payment" versus "sync" versus "ui" without inventing a separate metric for
each feature. Get them right and every chart can be filtered the way you think; get them wrong and
the dashboard turns into noise. The tag hygiene section is next, and it is short.
Device info is automatic and free. App version, binary version, OS, and hardware ship with every
batch without a single call from you. Do not re-log them. The one field you set by hand is
AppVersion, the release label, and that is exactly what makes version comparison possible later.
Tag hygiene and naming
A tag is there to filter with, not to carry data. Keep them short, few, and stable over time, and the dashboard stays legible even after a few years of additions.
In practice:
-
Use a small, fixed vocabulary:
payment,sync,ui,export,startup. A handful of tags covers most applications. If you find yourself inventing a new tag every week, stop. -
Name counters and timing ids in a
feature.operationstyle:report.render,invoice.export,sync.retry. The shared prefixes group naturally on the dashboard, so all yoursync.*numbers sit together without any configuration. -
Do not put an id, a timestamp, a filename, or a value that changes on every call into a tag. Each distinct value becomes a dimension of its own, so a tag carrying the order number creates thousands of them and the filter stops being any use. This is called high cardinality. If you need that value, the right place for it is the log message or a breadcrumb.
-
No personal data in tags or in log messages, which are retained and exported to CSV. Log ids and outcomes, not emails, names, tokens, or file contents. For identity there is the customer id field.
Set the context that never changes once, at startup, so you are not repeating it on every call:
EW.SetCustomerId('acme-corp');
EW.SetTag('edition', 'pro');
EW.SetTag('channel', 'stable');
From then on every event carries that context, and you can filter the whole dashboard down to, say, the Pro edition on the stable channel without touching another line of code.
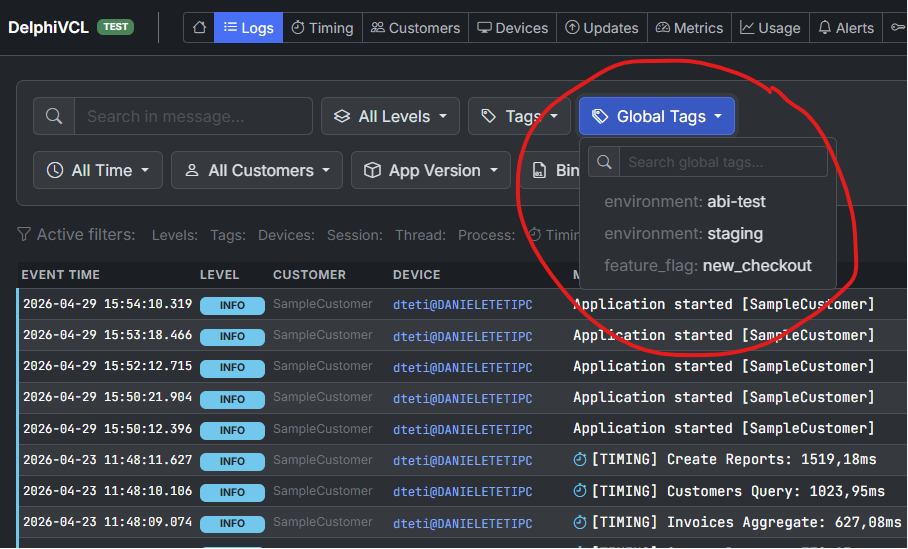
Tags you set with SetTag (or GlobalTags at init) become a Global Tags filter in the console, so
you can slice every view by environment, edition, feature flag, and whatever else you tagged.
The same calls, in every SDK
The recipes that follow use Delphi. The concepts are identical across SDKs; only the spelling changes. This table is the map, so a .NET or Python reader can translate any snippet at a glance. The console reference has the full signatures.
| What you want | Delphi (native) | .NET (EW) |
Python (ew) |
JavaScript (ew) |
DLL (flat C) |
|---|---|---|---|---|---|
Log an error with stack |
|
|
|
|
|
Log at a level |
|
|
|
|
|
Count something |
|
|
|
|
|
Record a gauge |
|
|
|
|
|
Periodic gauge |
|
|
|
|
(none: poll + |
Time an operation |
|
|
|
|
|
Nested trace |
|
|
|
|
|
Breadcrumb |
|
|
|
|
|
Set a tag |
|
|
|
|
|
Set the customer id |
|
|
|
|
|
Set the current user |
|
|
|
|
|
Two SDK-specific facts worth carrying into every recipe: the DLL has no periodic-gauge callback, so you drive it from your own timer, and JavaScript is browser-only. Everything else is a one-to-one rename.
Recipes
Each recipe starts from a situation you have been in, or will be, and works back to the one thing worth instrumenting. One canonical Delphi snippet each; use the table above to translate it to your SDK. Where behavior genuinely differs, it is noted.
Recipe #1: A customer says it crashed, and you have no idea why
The support ticket reads: "the program closed itself and I lost my work." No steps, no screenshot, no version number. Without any telemetry your only move is to ask the customer to reproduce a crash they cannot reproduce on demand, on a machine you cannot see. Half the time the ticket dies there, unresolved, and the bug stays in the field.
This is the situation logs and a stack trace exist for, and the good news is that turning it on is
one line of setup. Add ExeWatchSDKv1.VCL (for a VCL app) or ExeWatchSDKv1.FMX (for FMX) to your
uses clause, and the SDK hooks the framework exception path for you: every unhandled GUI exception is
captured as Fatal, tagged exception, with its stack trace, and flushed immediately so nothing is
lost as the app dies. If you forget the unit and the app is a GUI, the SDK notices and warns you to
add it. By the time the customer picks up the phone, the crash is already on your dashboard, with the
stack, the app version, the OS, and the customer id attached. You are no longer asking them to
reproduce anything; you are reading what happened.
The exceptions you catch and handle yourself do not travel through that hook, so log those explicitly with the exception overload, which carries the stack trace along:
try
  ProcessDocument(ADoc);
except
  on E: Exception do
  begin
    EW.ErrorWithException(E, 'document');
    // handle or re-raise as your app needs
  end;
end;|
A stack trace is only useful if you can read it. Captured raw, it is a list of memory addresses, not method names and line numbers. To get readable frames you have to hand the debug info to whatever resolves the stack. Three ways, pick the one that fits your build:
Without any of these the crash is still recorded, but the trace stays as addresses you cannot act on. Do this once at release time and every crash report afterward is worth reading. |
Across the other SDKs the shape is the same. .NET is EW.ErrorWithException(ex, "document") and
also auto-captures unhandled exceptions. Python is ew.error_with_exception(…). The DLL exposes
ew_ErrorWithStackTrace(Msg, Tag, StackTrace, ExceptionClass): a flat C ABI cannot walk the host
stack, so the host resolves the trace and passes the string in. The JavaScript SDK is browser only
(ew_web_ keys) and auto-captures window.onerror.
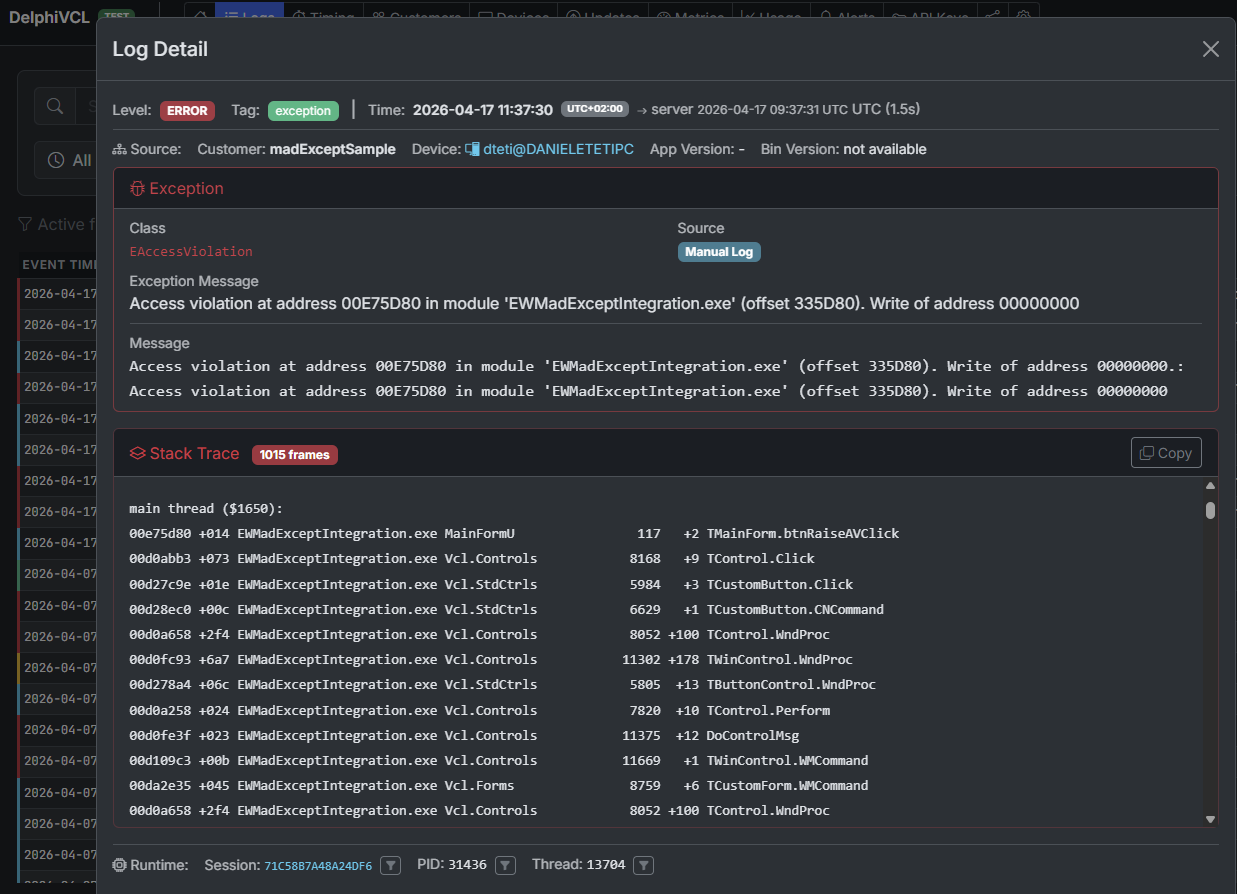
What a captured crash looks like on the dashboard: an EAccessViolation with its stack resolved to
unit, method, and line, alongside the session, device, and customer that hit it. This is a build
with symbol info; without it the same frames would be bare addresses.
The last piece is not having to watch the dashboard for crashes at all. Wire an alert on fatal
count (covered under Alerts below) and a spike reaches you by email, in minutes, instead of by
support ticket, in days.
Recipe #2: You have the stack, but not what the user did to get there
You know the error by heart. You know the line too:
SaveDocument, a nil reference, the sameEAccessViolationfor three weeks. The thing is, it only happens at one customer. Not on your machine, not on the other thirty installations, and two or three times a week at theirs. You do not have a bug to find, you have a sequence to guess: something that user does and the others do not, which leaves the program in a state where that line blows up. You can spend two weeks asking "what were you doing just before?" and get a different reconstruction every time, because nobody really remembers their own clicks. Or you can have the program tell you.
The stack trace answers the question where. Breadcrumbs answer the other half, the half you are
always missing: what the user was doing before. They are crumbs you drop while the application
works, and ExeWatch attaches them by itself to the next Error or Fatal, in order, next to the
stack.
Watch how you write them, though, because this is where almost everyone gets it wrong the first time. They are not five lines one under the other. Each one sits where the thing actually happens, spread across the application, and between one and the next the user goes through screens and minutes of work.
// TInvoiceForm.FormShow -- the user opens an invoice
EW.AddBreadcrumb(btNavigation, 'ui', 'Opened invoice ' + IntToStr(AInvoiceId));

// ... here the user works: scrolls the lines, corrects a taxable amount, saves ...

// TUserForm.ChangeRole -- the user changes role
EW.AddBreadcrumb(btUser, 'auth', 'Switched to admin role');

// ... here the user does yet more, maybe for a quarter of an hour ...

// TPriceListImport.Execute -- the user imports an external file
EW.AddBreadcrumb(btFile, 'io',
  Format('Imported %s (%d rows)', [ExtractFileName(AFileName), ARowCount]));

// TInvoiceDAO.ReloadLines -- happens underneath, the user does not even see it
EW.AddBreadcrumb(btQuery, 'db', 'Reloaded the invoice lines');

// TInvoiceForm.BtnExportClick -- the last step before the crash
EW.AddBreadcrumb(btClick, 'ui', 'Clicked Export');
ExportInvoice(AInvoiceId);   // <-- the exception fires here, and the five crumbs come with it
Notice the values inside the messages too: the invoice number, the file name, the row count. Those values never belong in a tag, because each distinct value becomes a dimension and blows your dashboard apart. In a breadcrumb message they fit perfectly, and that is exactly where they earn their keep, because the difference between "imported a file" and "imported pricelist_2026.csv with 1284 rows" is the whole distance between a trail and a diagnosis.
When that crash lands on the dashboard you are no longer reading that there is an access violation
inside SaveDocument. You are reading that this customer, and only this customer, imports an
external price list before exporting, and that your export code has never seen rows shaped like
that. The sequence you could not get anyone to describe is written right there.
The same thing helps in the more elusive version of the problem, the one where the error hits many customers but not always. With a dozen crashes on the dashboard you stop reasoning by hypothesis and start comparing trails: if a certain step appears in all of them and never appears in healthy sessions, the guessing is over. It is the same work you would do with logs, except you did not have to predict in advance which log you would need.
The type is one of a fixed set of sixteen values (btClick, btNavigation, btHttp, btQuery,
btUser, btForm, btFile, btState, btTransaction, btConfig, btCustom and others), and
the dashboard uses it to give an icon and make the trail readable at a glance. There is a short form
too, EW.AddBreadcrumb('Export started'), when all you want is to leave a note.
Four behaviors to know, because they change what you find in front of you when it counts:
-
The trail is per thread, and threads cannot see each other. Each thread keeps its own crumbs. If the user clicks Export on the main thread and the error then blows up in a background thread, the click is not in the trail attached to that error. When you start asynchronous work, drop a crumb inside the worker too, with what you handed it, otherwise the story breaks exactly where you need it.
-
The last 20 per thread are kept. The twenty-first drops the oldest, so what attaches to a crash is the immediate run-up and not the whole session. This is why they do not belong inside a loop: twenty
btQueryiterations fill the trail and erase the context that came before them. -
They attach to
ErrorandFatalonly. AnInfoor aDebugdoes not carry them, and on their own they are never sent. So they cost no quota until a failure uses them. -
They are consumed. Once attached to an error, the trail for that thread is emptied, so the second error does not drag along the run-up of the first. Worth knowing, though: if the same operation fails twice in a row, the second event carries only the crumbs dropped in the meantime. Faced with a pair of errors, the one with the complete story is the first.
What is worth a breadcrumb: moving from one screen or dialog to another (btNavigation, btForm),
the outbound calls you make (btHttp), the queries that matter (btQuery), the actions with which
the user changes the state of the program, login, role switch, company switch (btUser), and the
files the user opens or imports (btFile). The rule of thumb is simple: if tomorrow, looking at a
crash, you would want to ask "what had they done before?", that is a crumb to drop today.
What the dashboard gives back: open the crash and next to the stack you find the last twenty steps that led to it, in order, with type and category. The same crash from two different customers reads as two different stories, and that is usually where it becomes clear which of the two is yours.
Recipe #3: You are about to argue about a feature nobody may be using
A planning meeting. Someone is certain the batch-export feature is essential and wants two weeks to extend it. Someone else thinks almost no one touches it. Both of them are guessing, because neither has a number, and the loudest voice usually wins that kind of argument. It is exactly the kind of question a single counter settles for good.
Drop one counter at the entry point of each feature you care about. A counter is the right tool here, not a log, because the question is "how many," and counters are summed into rollups on the backend, so what you read back is the total across every installation, cheaply, without you storing one row per click.
EW.IncrementCounter('report.generated', 1, 'reporting');|
Increment once per logical use, not once per iteration. If generating a report processes 500 rows,
that is still one use of the feature, so one increment, not 500. Counting the rows would measure
the size of your reports, not how often people use the export, and the second is the question you
wanted answered. If the first interests you as well, that is a separate gauge:
|
A month later the dashboard ranks your features by real usage, and the roadmap argument is settled by evidence: you extend what people use and quietly retire what they do not.
Recipe #4: A release "feels slower" and nobody can prove it
You ship v4.2. Within a week two customers mention the main report "seems sluggish since the update." Is it real, or is it the usual suspicion that follows any change? You cannot tell, because "feels slower" is not data, and asking the customer to time it with a stopwatch is not a plan.
The fix is to measure the operation in the field and tag every measurement with the release that produced it. Wrap the operation in a timing pair, and set the release label at init so every sample knows its version:
EW.StartTiming('report.render', 'reporting');
try
  RenderReport(AReport);
finally
  EW.EndTiming('report.render');
end;|
Always close the pair in a |
The release label comes from init: InitializeExeWatch(ApiKey, CustomerId, '4.2.0') sets
AppVersion for the run, while the binary version is auto-detected separately, so you get both. Now
the workflow that answers the question: after the release has been live long enough to gather
samples, open the Timing page, filter by time window, and use Export CSV. The file respects your
active filters and opens in Excel, where you pivot average and p95 duration by app_version. The
sluggishness stops being an opinion and becomes "report.render went from 120ms to 300ms in 4.2,"
which you caught from your own field data before it turned into churn. A native in-UI "filter by
version" view is on the backlog; until it ships, the CSV pivot is the supported path, and the same
export works for Logs, Timing, and Metrics alike.
Recipe #5: "Checkout is slow", but slow where?
Customers say checkout takes forever. You time the whole thing and it is four seconds. That number is almost useless on its own, because four seconds of what? Loading the cart? The payment gateway? Rendering the receipt? Optimizing blind, you could spend a day making the database query faster and move the total from four seconds to three-point-nine, because the real cost was somewhere else entirely.
Nested traces break that four seconds apart. Start a trace, run a timing around each phase inside it, and end the trace. The backend reconstructs a waterfall, one bar per phase, so you can see which child actually dominates:
EW.StartTrace('checkout');
try
  EW.StartTiming('checkout.db', 'checkout');
  LoadCart(ACartId);
  EW.EndTiming('checkout.db');

  EW.StartTiming('checkout.payment', 'checkout');
  ChargeCard(ACard);
  EW.EndTiming('checkout.payment');

  EW.StartTiming('checkout.render', 'checkout');
  RenderReceipt;
  EW.EndTiming('checkout.render');
finally
  EW.EndTrace;
end;
StartTrace returns a trace id and EndTrace returns the total elapsed milliseconds, so you can log
or assert on the total if you want, and each nested timing becomes a child span. On the dashboard
"checkout is slow" turns into "payment is 80% of checkout," which tells you the problem is the
gateway, not your code, and saves you the day you would have spent optimizing the wrong phase. .NET
and Python mirror this exactly; the DLL uses ew_StartTrace(Name, Buffer, BufLen), which writes the
trace id into a caller-provided buffer, and ew_EndTrace(&ElapsedMs).
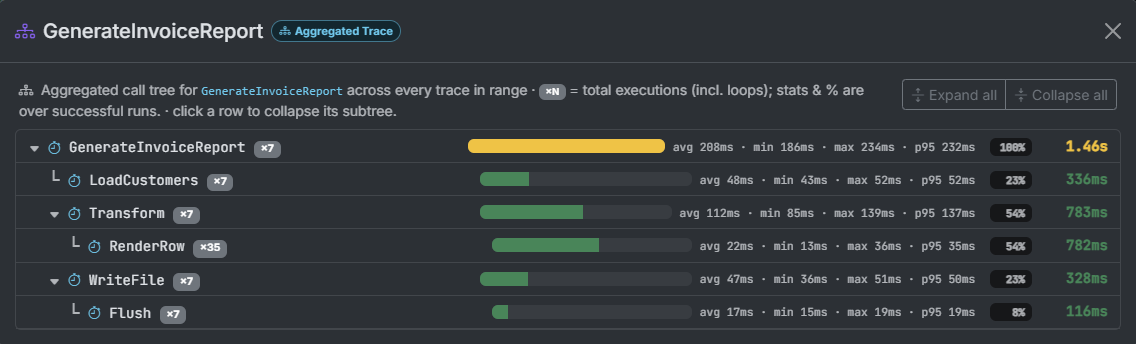
An aggregated trace: each phase is a bar with its avg, min, max, and p95, and the percentage tells you how much of the parent it accounts for. Here the transform and render phases dominate, so that is where the time goes. The statistics are computed over successful runs, so a failed phase does not skew them.
What happens if you forget to close a timing
You will forget an EndTiming eventually. The SDK is built to survive it without leaking memory or
reporting a wrong number, but what you get is never as good as a clean pair, which is the real reason
for the try/finally. Here is exactly what happens to an open timing, depending on how it ends up:
-
Nothing, if it just stays open. A timing with no matching
EndTimingnever emits a sample. It is not counted and not averaged, simply absent. You silently lose that one measurement. -
Auto-closed as failed if you start the same id again. Call
StartTiming('report.render')while a previousreport.renderis still open on the same thread and the SDK closes the old one for you, markedsuccess = falseand flaggedauto_closed, with a Warning in your logs ("auto-closed, duplicate StartTiming"). Being failed, it stays out of your duration stats; the Warning is there to tell you the code has a hole. -
The oldest is evicted if too many pile up. Each thread keeps at most 100 open timings. Start a 101st and the oldest open one is force-closed as failed, again with a Warning. This is the backstop that stops a slow leak of forgotten timings from growing without bound.
-
A trace cleans up its children. If the forgotten timing is nested inside a
StartTrace/EndTrace,EndTraceforce-closes any child span you left open, marked failed, so the waterfall is still complete.
The pattern across all four: a forgotten EndTiming becomes a failed sample plus a Warning, never a
clean duration. That is the machinery protecting you, not a feature to lean on. Wrap every pair in
try/finally and none of it ever fires.
Recipe #6: The app is fine at 9am and crawling by 5pm
A customer reports that your application is snappy in the morning and sluggish by the end of the day, and a restart fixes it until tomorrow. That pattern is a resource leak, and it is invisible to a crash reporter, because nothing crashes. It just degrades, quietly, over hours, on a machine you never see.
A leak is a level that climbs and does not come back down, which is exactly what a gauge measures. You do not want to sprinkle gauge calls through your render loop; you want the value sampled on an interval. Register a periodic gauge and the SDK sampler thread reads your callback for you, with no timer of your own:
EW.RegisterPeriodicGauge('mem.working_set_mb',
  function: Double
  begin
    Result := CurrentWorkingSetMB;
  end,
  'runtime');
Good things to watch this way: working set in MB, GDI or handle count, open document count, cache
size. After a day or two the dashboard shows the signature plainly, a sawtooth climbing all through
each session and dropping at restart, and because a gauge keeps average, min, max, and sample count
per window, the rising average and max are the leak. Slice by app_version and you can often pin it
to the exact release that introduced it.
One divergence to respect: the periodic-gauge callback exists on Delphi, .NET (a Func<double>),
Python, and JS, but not the DLL, because a callback cannot cross the flat C ABI. With the DLL the
host owns the interval: run your own timer and call ew_RecordGauge(Name, Value, Tag) each tick.
Recipe #7: Is it everyone, or just one customer?
Your logs show a burst of sync errors and your first instinct is that the whole fleet is failing. Before you panic, ask whether this is hitting everyone or just one customer with an unusual setup, and notice that scrolling raw logs from 200 installations will never tell you.
If you set the customer id at init and tag your logs by subsystem, you can isolate any slice cleanly:
EW.SetCustomerId('acme-corp');
// ... later, on the sync path:
EW.Error('Sync rejected by server', 'sync');
Now filter the dashboard to Acme’s sync errors and the picture resolves in seconds: it is one
customer, behind a corporate firewall, not your code failing everywhere. Take it one step further and
create an alert scoped by customer_external_id and tag, and you get paged about Acme’s sync
problems specifically, while staying silent about the other 200 customers who are fine. Per-customer
and per-feature error rates, each alertable on its own, all out of consistent tagging.
Recipe #8: How often does it actually fail?
"Sync sometimes fails" is the kind of report that hides the only thing you need to know: how often is sometimes? Once a week is a shrug; every third attempt is an incident. You cannot prioritize it until you can see the ratio.
The simplest version is a counter per outcome, sliced by an outcome tag:
if TrySync then
  EW.IncrementCounter('sync.result', 1, 'success')
else
  EW.IncrementCounter('sync.result', 1, 'failure');
But if you are already timing the operation, you do not need a second counter, because EndTiming
carries a success flag as its third parameter (default True):
EW.StartTiming('sync', 'sync');
try
  DoSync;
  EW.EndTiming('sync', nil, True);   // succeeded
except
  EW.EndTiming('sync', nil, False);  // failed, but the timing still closes
  raise;
end;
This flag does something subtler than a counter, and it is worth understanding. A failed timing is not discarded: it is recorded, so you can count failures and see them in the timing list. But it is left out of the duration statistics. The average, min, max, and p95 on the Timing page are computed from successful runs only. That matters because failures are often the slowest calls, an operation that gave up after a 30-second timeout, and if those counted toward your latency you would think your sync got slower when really it started failing. With the success flag you read the true latency of the runs that worked and the failure rate, from one call.
Counter, gauge, or timing: which one
Those three tools get confused constantly, and confusing them does not throw an error, it silently records data that means nothing, which is worse. The distinction is simple once you say it out loud:
| Tool | Answers | How it aggregates | What using the wrong one costs you |
|---|---|---|---|
Counter |
how many, how often |
summed over the window |
a gauge for "number of exports" throws away the total |
Gauge |
what is the value right now |
average, min, max, sample count per window |
a counter for "queue depth" adds levels into nonsense |
Timing |
how long did it take |
duration distribution, with traces |
a counter for "how slow" gives you a count, not a duration |
When in doubt, try adding two readings together. If the sum is meaningful, 12 exports plus 8 exports really is 20 exports, it is a counter. If the sum is nonsense, a queue of 12 plus a queue of 8 is not a queue of 20, it is a gauge. If what you care about is elapsed time, it is a timing.
Alerts that matter
An alert is what lets you stop watching the dashboard. Instead of checking in and hoping to catch a problem, you describe the problem once and ExeWatch emails you when it happens. Two kinds ship today, and it pays to know exactly what each one fires on, because the honest limits of alerting shape how you use everything above.
Log-volume alerts fire when the count of log events at or above a level crosses a threshold
inside a window. You set threshold (a count), window_minutes, min_level (default error), an
optional tags filter, an optional customer_external_id, and cooldown_minutes (default 60) so
one incident does not page you fifty times. A typical one reads: "more than 20 fatal events in 15
minutes for customer Acme."
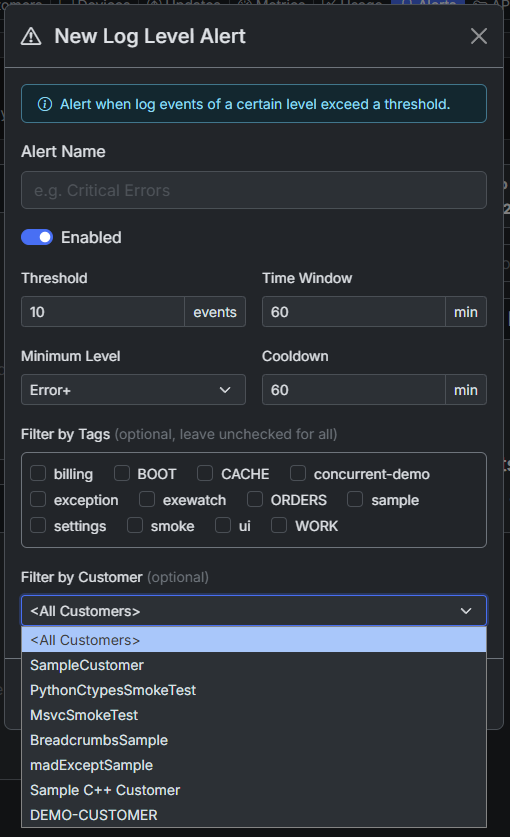
The same alert as a form in the console: a threshold over a time window at a minimum level, with a cooldown, optionally narrowed by tag and by customer. Scoping "Filter by Customer" to Acme is how you get paged about Acme’s errors without hearing about anyone else.
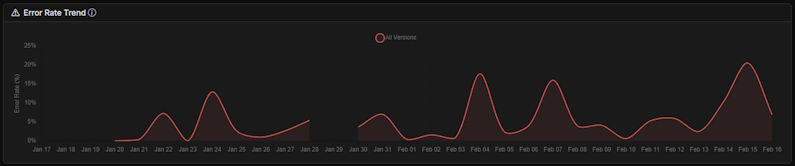
Error rate over time. A spike like the ones here is exactly what a log-volume alert watches for, so it reaches you by email the moment it starts instead of when you happen to open this chart.
Timing alerts fire when operations matching a timing id pattern run slower than a duration
threshold, often enough to cross a count threshold inside a window. The fields are a
timing_id_pattern, a duration threshold in milliseconds, an occurrence threshold (default 5),
window_minutes, an optional customer_external_id, and cooldown_minutes (default 240). This is
how you get told "report.render is running slow in the field" without watching for it.
|
It is just as important to know what alerts do not do today. There is no "alert when a gauge goes above X" or "alert when a counter exceeds X." Alerts fire on log-event counts and on timing, not on arbitrary metric values. So if you want to be paged when memory or queue depth crosses a line, the straight answer is that you cannot yet; you watch the gauge on the dashboard. Threshold alerting on metric values is not a feature at the moment. |
The way to keep alerts useful instead of ignored: keep your log levels honest (see anti-patterns, or
your error threshold fires on things that are not errors), scope each alert by tag or customer so
it has a clear owner, and set a cooldown long enough that one real incident arrives as one email.
Comparing versions with CSV export
You ship a release and want to know whether it got slower or noisier than the last one. Today that comparison runs through CSV export, and the workflow is worth spelling out because it answers a question customers raise constantly.
-
Ship the release with
AppVersionset at init (InitializeExeWatch(ApiKey, CustomerId, '4.2.0')). Every event now knows which version produced it. -
Give it time in the field to gather samples, then open the Timing page and set your filters: time window, tag, customer.
-
Use Export CSV. The file respects those active filters and opens in Excel.
-
Pivot average and p95 duration by
app_version, and the regression, if there is one, is right there in the pivot table.
The same export exists on the Logs and Metrics pages, so you can compare error volume or metric levels across versions the same way. An in-UI per-version timing filter is on the backlog; when it lands, this becomes a couple of clicks instead of a pivot. Until then, the CSV route is the supported way to do version-over-version comparison, and it works well enough that plenty of teams stop here.
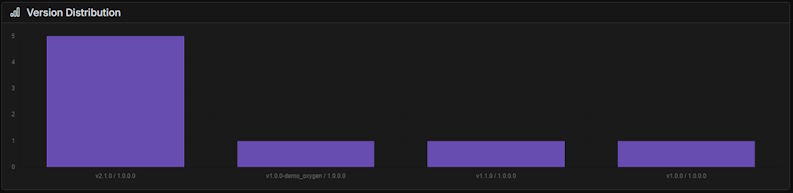
Because every event carries its AppVersion, the console already knows how your releases are spread
across the field. That same version label is what you pivot the exported timing by.
Putting it together: instrumenting a real method
Isolated calls are easy to nod along to and hard to place. So here is instrumentation dropped into ordinary code: a sync method on a data module, the kind every line-of-business Delphi app has. First the plain version, doing its job with no telemetry:
procedure TSyncModule.SyncInvoices;
var
  Response: IHTTPResponse;
begin
  Response := FHttp.Get(FBaseUrl + '/invoices?since=' + FLastSync);
  if Response.StatusCode <> 200 then
    raise ESyncError.CreateFmt('Sync rejected by server: HTTP %d', [Response.StatusCode]);

  FConnection.StartTransaction;
  try
    ImportInvoices(Response.ContentAsString);
    FConnection.Commit;
  except
    FConnection.Rollback;
    raise;
  end;
  FLastSync := NowUtcIso;
end;
Now the same method instrumented, each addition doing exactly one job:
procedure TSyncModule.SyncInvoices;
var
  Response: IHTTPResponse;
begin
  EW.AddBreadcrumb(btHttp, 'sync', 'GET /invoices since ' + FLastSync);  // trail for a later crash
  EW.StartTiming('sync.invoices', 'sync');                              // time the whole operation
  try
    Response := FHttp.Get(FBaseUrl + '/invoices?since=' + FLastSync);
    if Response.StatusCode <> 200 then
      raise ESyncError.CreateFmt('Sync rejected by server: HTTP %d', [Response.StatusCode]);

    EW.StartTiming('sync.import', 'sync');                              // isolate the db phase
    FConnection.StartTransaction;
    try
      ImportInvoices(Response.ContentAsString);
      FConnection.Commit;
      EW.EndTiming('sync.import', nil, True);
    except
      FConnection.Rollback;
      EW.EndTiming('sync.import', nil, False);                          // failed run, out of the stats
      raise;
    end;

    FLastSync := NowUtcIso;
    EW.IncrementCounter('sync.completed', 1, 'sync');                   // one per successful sync
    EW.EndTiming('sync.invoices', nil, True);
  except
    on E: Exception do
    begin
      EW.EndTiming('sync.invoices', nil, False);
      EW.ErrorWithException(E, 'sync');                                 // crash + stack + breadcrumb
      raise;
    end;
  end;
end;
What went where, and why:
-
The breadcrumb goes at the top, before the call it describes, so if anything downstream throws, the trail already records the request that led there.
-
The outer timing (
sync.invoices) wraps the whole operation; the inner timing (sync.import) isolates the database phase, so the waterfall separates network time from import time. -
A server that answers badly raises an exception, like any other failure: with a status other than 200 there is nothing to import, and the caller has to know the sync did not happen. Notice that this adds no instrumentation, it removes some: the HTTP failure ends up in the same handler at the bottom, which logs it with its exception class and the breadcrumbs, instead of a branch that writes its own log and timing close.
-
Every
EndTimingsits on both the success and the failure path, passingFalsewhen it failed, so a broken sync never pollutes your latency numbers. -
The counter increments once, only on success, so
sync.completedis a true count of good syncs. -
The error is logged with the exception at the outermost handler, where it carries the stack and the breadcrumb above it, then re-raised so the app’s own error handling is unchanged.
Notice the shape: instrumentation frames the real code, it does not replace it. Delete every EW.
line and the method still works exactly as before. The instrumentation only watches.
Anti-patterns
None of these is "you logged too much." They are the cases where what you send misleads you instead of helping you, and the fix sits next to each one.
Repeating the same line inside a loop. A Debug call in a hot loop, or an IncrementCounter on
every iteration. The point is not the quantity. It is that five hundred identical lines all answer
the same question the first one already answered, and meanwhile they eat the quota the real events
needed. Record the operation, not its iterations: one line when it starts, one when it finishes or
fails, and a single counter increment per logical operation. If you genuinely need the per-iteration
detail during a diagnosis, keep it at Debug level and raise the minimum level of the application
from the console when you are done.
Personal data in logs. Emails, names, tokens, or file contents in a message or a tag. Logs are retained and exportable to CSV, and tags are low-cardinality dimensions, not payloads, so this is both a privacy problem and a mess. Log ids and categories; use the customer id field for identity.
Levels that lie. Everything logged at Error, or genuine failures logged at Info. Alerts
default to min_level = error, so if your levels are wrong your alerts are wrong with them, and you
are either paged for nothing or never paged at all. The scale that keeps them honest: Fatal means the
app cannot continue, Error means an operation failed, Warning means degraded but working, Info means a
notable state change, Debug means developer-only detail.
Gauge and counter, swapped. A counter for "current queue depth" sums levels into a meaningless total; a gauge for "number of exports" throws the total away. Apply the addition test from the table above before you pick.
Tags that explode. An id, a timestamp, or any per-request value in a tag. Tags are dimensions with a small fixed set of values; unbounded values multiply into thousands of one-off dimensions and make the dashboard unusable. Keep the vocabulary small.
Re-logging what you already get for free. Manually logging OS, version, or hardware that already
ships in the device snapshot with every batch. Do not. The only field you set by hand is
AppVersion, the release label.
What happens if the internet connection drops?
Desktop apps run on laptops that go into tunnels, on machines behind flaky VPNs, on a PC someone unplugs from the network at closing time. So this is a fair question: what happens to your telemetry when the SDK cannot reach the server?
Nothing is lost. The SDK does not send events straight from the call site. It buffers them, writes them to disk, and a background shipper thread does the sending. When the network is down the send simply fails, the files stay on disk, and the shipper retries on an interval. The moment connectivity returns, the queued files are shipped in order. A crash logged on a plane lands on your dashboard the next time the laptop gets online.
Four settings on TExeWatchConfig shape this:
-
StoragePathis where the pending files live. It defaults to a per-app folder; point it somewhere your app can always write. -
FlushIntervalMs(default 5000) is how often the in-memory buffer is written to disk. Shorter means less is at risk if the process is killed mid-run; longer means fewer, larger writes. -
RetryIntervalMs(default 30000) is how often the shipper retries after a failure. This is your reconnect cadence: a lower value clears the backlog sooner once the network is back, at the cost of more attempts while it is still down. -
MaxPendingAgeDays(default 7) caps how long unsent files are kept. A machine offline longer than this drops the oldest data instead of shipping a weeks-old flood on reconnect. Set it to 0 to keep everything, unlimited.
You can watch the backlog yourself: GetPendingCount returns how many events are still waiting to
ship.
|
A dropped connection is not a |
Instrument what is meaningful, at the right level
One technical fact to know, and it comes at the end of the guide on purpose: the monthly quota is a
live count of the rows you send during the month. Logs and metric updates count together, that is
counters, gauges and timings, not logs alone. The internal SDK messages, the ones tagged
ew.system, are left out of the count.
This is not an invitation to instrument less. The right order is the one you have followed so far: first you decide what you want to see, then, if and when volume becomes a topic, you manage it. The tools to manage it exist, and nobody is asking you to give up a number you care about.
-
The minimum level is set per application from the console, and the SDK picks it up on its next connection. You can develop with all the
Debugyou want and then keep onlyInfoand above in production, without touching the code and without shipping a new build. -
Also from the console, sampling sends only a fraction of routine events.
ErrorandFatalalways bypass it, so you can thin out a verbose log across ten thousand installations without losing a single crash. -
Aggregate what is pure repetition: one increment per logical operation instead of one per loop iteration.
-
Use tags to slice, so one well-tagged metric saves you ten near-duplicate ones.
If you sit consistently close to the ceiling with instrumentation you need all of, there is nothing to cut: you are watching more applications or more customers than when you chose the plan, and at that point it is worth moving up a tier.
|
Past the monthly quota the SDK receives a |
On the roadmap
A few things people ask for are planned but not shipped. They are listed here, honestly, so you know where today’s edges are and do not go looking for a feature that is not there yet.
-
Detecting when an app goes silent. A dead-man’s-switch, so you hear about the customer whose app stopped checking in, not just the one whose app threw an error. Alerts today fire on events that happen, not on events that stop happening, so this is not possible yet. Planned.
-
Anomaly detection. Automatic "this looks off" surfacing on metrics, instead of you setting fixed thresholds. Not built yet.
-
A usage analytics page. A dedicated view for feature adoption and usage patterns beyond raw counters. Not built yet.
-
A read / query API. Today API keys are ingest-only, so pulling your data out for automated reporting waits on this. The CSV export is the manual path in the meantime.
For anything that does exist today, the SDK reference in the console has the exact signatures, config keys, and installation steps. This guide is the what and the why; that one is the how.